
A modeler ventures into the field.
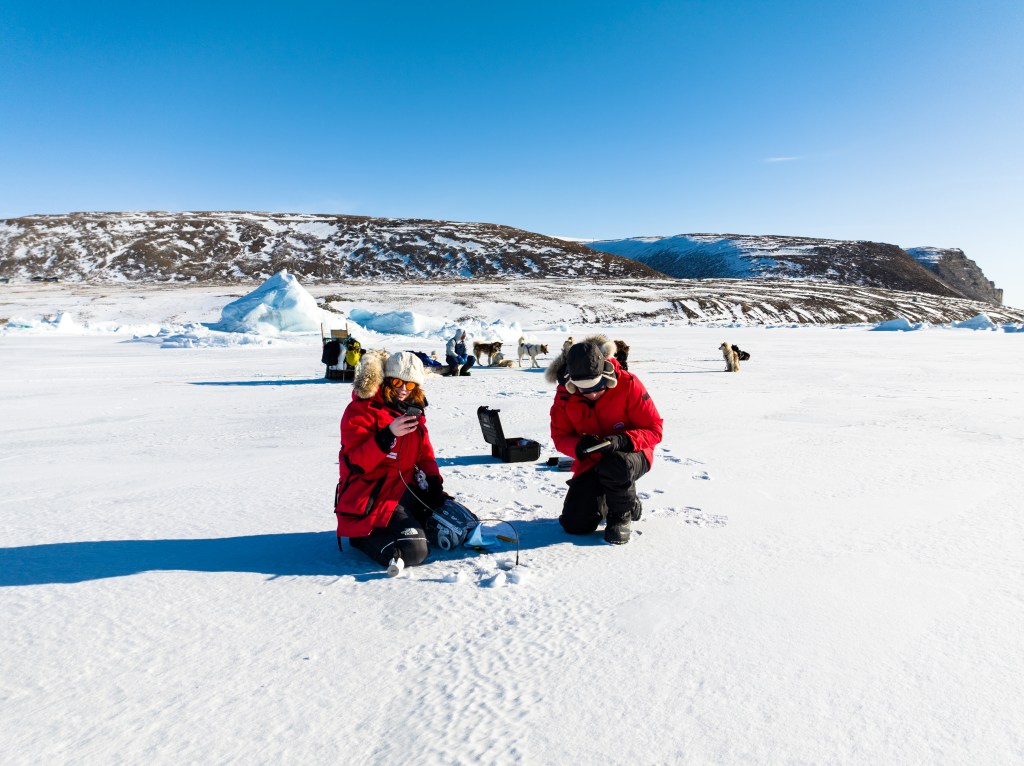
I’ve spent hours looking at snow through the lens of data and code. But recently, my colleague Abraham and I swapped the desks at the Danish Meteorological Institute for the snowy landscape of Qaanaaq, North Greenland. For five days, we were stationed at the DMI “Snow Observatory.” This was my very first time working “in the field.”
In Greenland, the weather dictates your schedule. Due to days of cancelled flights, common in Greenland, time was of the essence! The most exciting part was the first Greenland deployment of a Cosmic Ray Neutron Sensor developed at the University of Sheffield. This instrument looks inconspicuous. It’s a black tube covered in white plastic, but inside hides a sensor that counts cosmic ray neutrons! High-energy cosmic rays bombard Earth from space, interacting with the atmosphere and creating a shower of neutrons. When these neutrons hit snow (which is full of hydrogen), they slow down and are captured by the sensor. By measuring the number of neutrons, we can figure out how much snow is sitting on top of the sensor.
But the main task was to study the snow conditions by digging many snow pits to measure temperature, density, and grain sizes in as many locations around Qaanaaq as possible. Snow grain size is different from a snowflake. When a snowflake lands on the snowpack, it starts to metamorphose and clump together, either packing down as additional snow falls on top, melting and refreezing when weather permits, or being pushed by strong polar winds to land and settle elsewhere.
On location, we were supported by DMI’s most northern employee, Aksel Ascanius, and a local hunter, Qillaq Danielsen, with his pack of sledge dogs. I feel a deep sense of gratitude for this experience. I am in total awe of the power, but also gracefulness of nature. Looking back, I think the five-year-old version of me would be very happy to know that her “grown-up job” is to measure snow and air!
Back home, these measurements provide valuable input for the polar-optimized regional climate model Harmonie-Climate (HCLIM) and snow model CISSEMBEL, which help to improve our understanding of the Polar climate and lead to better climate forecasts over polar regions.
(03.05.26)
How much sunlight does the Antarctic sea ice reflect back to space?
❄️ The Antarctic sea ice is vast, covering around 19 million km² in the austral winter and 3.5 million km² in the austral summer. Winter sea ice effectively doubles the area of the white and bright, highly reflective surface of the Antarctic continent itself, which spans 13.66 million km². Sea ice is crucial for the polar climate because it reflects far more sunlight than the dark open ocean, helping regulate the Earth’s surface energy balance.
Sea ice consists of ice floes of varying thickness, typically covered by snow, and is fragmented by cracks, leads, and polynyas. Its surface reflectivity, known as albedo, depends on snow and ice characteristics. Fresh, dry snow can reflect up to 90% of incoming sunlight, while melting bare ice reflects only about 40%. In contrast, open water reflects only about 6%.
When sea ice and snow cover melt, the surface darkens, absorbs more sunlight, and warms further — also affecting the surrounding air temperatures. This positive surface albedo feedback accelerates melting and warming. While it has been well studied in the Arctic, where it contributes to Arctic amplification, it has received less attention in the Antarctic. Getting this feedback right is crucial for accurate climate model predictions.
My colleagues and I assessed how well different climate and ocean models — all of which include sea ice and snow components — simulate Antarctic sea ice albedo. We compared model outputs with field campaign measurements from ISPOL (Weddell Sea, December 2004) and Marsden (McMurdo Sound, November 2022), as well as satellite observations.
Our results show that many models use simpler snow and sea ice reflectivity parameterizations, which struggle to capture the spatial variability of sea ice albedo. Models with the most advanced albedo schemes perform best overall, but challenges remain. In drier regions like the Ross Sea, key difficulties include representing fractional snow cover and the dependence of snow albedo on snow depth. Interestingly, higher-resolution models do not always outperform lower-resolution ones if small-scale variations in sea ice, snow patchiness, and blowing snow are not properly accounted for.
This motivated me to examine the regional climate model (called HCLIM) I use in my daily work and begin developing its surface snow scheme to better suit both Antarctic and Arctic conditions!❄️
• And finally, here is our research article.
(29.10.2025)
☔ In a newly published study, led by Dr. Ella Gilbert (at the British Antarctic Survey), we reveal that rain is falling in Antarctica even at sub-zero temperatures (as supercooled drizzle), driven by atmospheric rivers—long, narrow bands of air that transport heat and moisture from the tropics to the poles.
Rain is still rare in Antarctica, but it is difficult to measure and can make ice shelves (floating ice) and ice sheets (on land) more vulnerable to damage and weakening.
• Check out the YouTube video on Ella’s channel explaining it all.
• Ella also wrote a nice Carbon Brief article
• And finally, here is our research article.
(13.02.2025)
I was featured in the “Young Researchers in the Spotlight” article by our PolarRES project. Read more about my journey through science at: https://polarres.eu/polarresnews/young-researchers-in-the-spotlight-kristiina-verro/ (12.02.2024)
Polar climatology. I wrote a short piece for PolarRes.eu on the importance of the Antarctic sea ice, highlighting its crucial role in regulating the Earth’s climate and supporting diverse ecosystems in the region. You can read the full article on the PolarRes.eu website: https://polarres.eu/polarresnews/antarctic-sea-ice/ (01.12.2023)
Astrophysics. Galaxies are complex islands of stars, gas, dust and dark matter held together by gravity. They come in different shapes and sizes and can contain billions of stars. Galaxies have complicated histories shaped by galaxy interactions and mergers, and the evolution of their stars. The distribution of stars in a stellar system changes over time, as massive stars leave the main sequence already in a few to few tens of millions of years after formation, and as the star formation rate itself changes in longer timescales. This results in the transformation of the galaxy. The story of the formation and evolution of galaxies is written into the properties of their stars. We cannot observe individual stars in distant galaxies, but only the sum of the starlight. To disentangle the history of a galaxy from observations, we need to create a set of models to describe the total starlight of a population of stars.
The aim of my PhD thesis was to do so. Read the full summary for non-experts here:
https://pure.rug.nl/ws/portalfiles/portal/245343601/Chapter_6.pdf
My full PhD thesis “The X-shooter Spectral Library and stellar population models” is available here: https://research.rug.nl/en/publications/the-x-shooter-spectral-library-and-stellar-population-models (defended 18.10.2022)
